My Accounts
Overview
-
Quarterly and yearly summaries of all sales cases of your accounts.
-
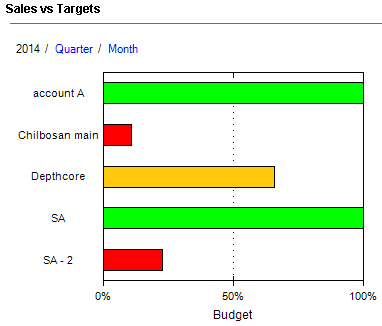
A chart showing how sales for each account are doing compared to the plan (budget). (green – good, yellow-worry, red – bad)
-
Table view lists In lists objects are represented by small icons and object names. Icons help you to recognize object types. Press a keyboard character (a letter or a digit) to jump to the list item that starts from this character. The first matching item will be chosen, counting from the top of the list. details for all your accounts.
Accounts Summary
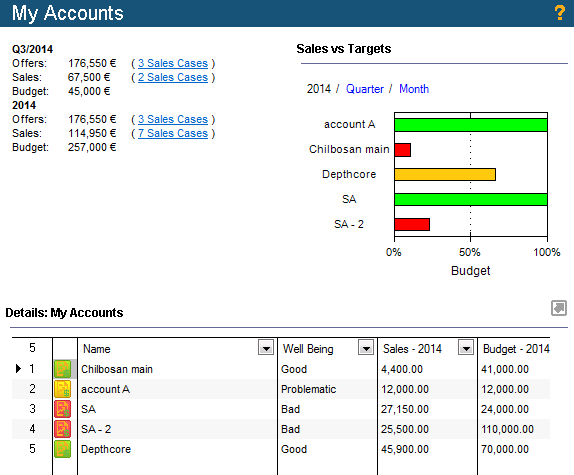
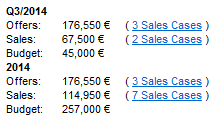
The My Accounts gives your account summaries for the current quarter and whole year.
Each summary includes:
-
Offers – sums up the values of all sales cases in the Offer phase In Vine Marketing, a phase is an independent stage of a query. It has its operation type and criteria loaded in its Contents field. connected Vine objects are linked to each other by connections. Vine shows an object together with links to all objects directly connected to it. to sales accounts you are responsible for.
-
Sales – sums up the values of all sales cases in the Contract phase connected to sales accounts you are responsible for.
-
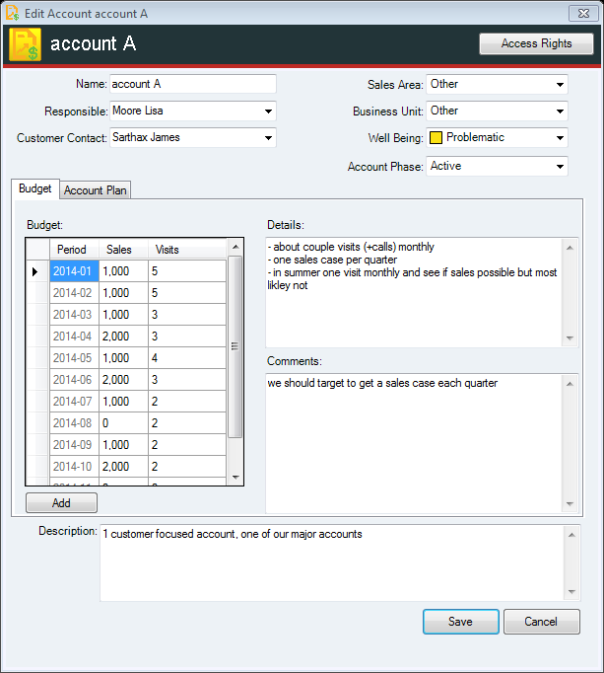
Budget – Sums up the budgets of all accounts you are responsible for::
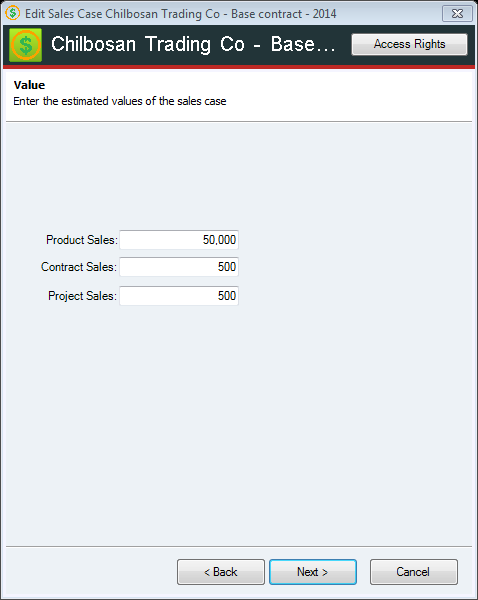
Calculating value of a sales case
A value of a sales case is calculated using the following formula:
Product Sales + Project Sales + Contract Sales * 12 (unless a different value specified by the vy_salescase_sales3_factor system setting):
Calculating budget of an account
The quarterly and yearly budgets of an account are calculated using the Budget values saved for the account:
Sales vs Targets Chart
This chart shows the ratio of sales for each account versus its planned budget:
-
Red = bad
-
Yellow=worry
-
Green = good
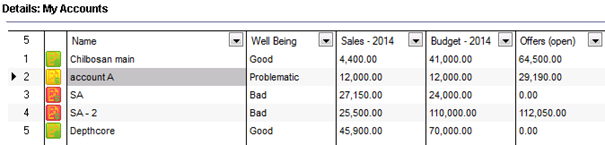
Account Details
The Details show all your sales account in a table view.