My Sales Overview
-
Top left chart shows how well your sales were doing each month compared to the plan (budget).
-
To the right of the chart you can see exact numbers of your sales and budget for each month. You can click the year to toggle the shown data for the current or previous year.
-
Below the chart, information about your sales cases is grouped by the current month, quarter and year
-
The Offers pane lists In lists objects are represented by small icons and object names. Icons help you to recognize object types. Press a keyboard character (a letter or a digit) to jump to the list item that starts from this character. The first matching item will be chosen, counting from the top of the list. all your sales cases in the Offer phase In Vine Marketing, a phase is an independent stage of a query. It has its operation type and criteria loaded in its Contents field.
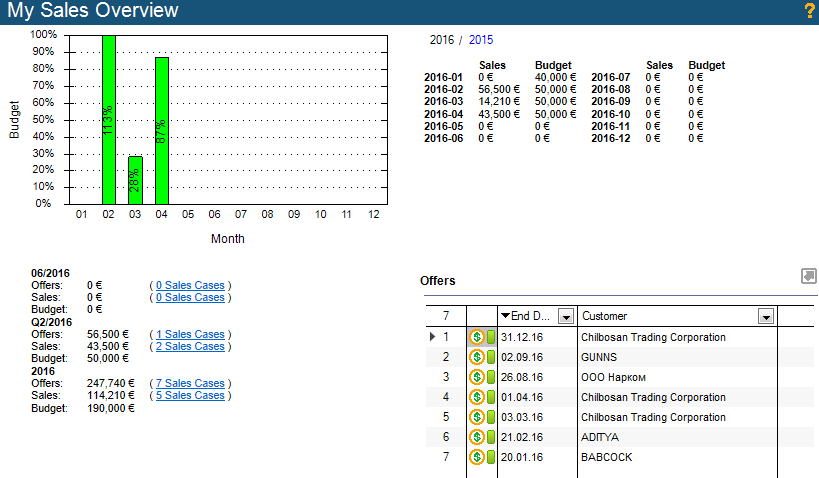
Below, your sales cases are grouped by the current month, quarter and year to provide the following summaries for these periods:
-
Offers – sums up the values of all your sales cases in the Offer phase.
-
Sales – sums up the values of all your sales cases in the Contract phase.
-
Budget – gives your personal budget for the period.