Offer Report
Select ANY from the Sales Person list In lists objects are represented by small icons and object names. Icons help you to recognize object types. Press a keyboard character (a letter or a digit) to jump to the list item that starts from this character. The first matching item will be chosen, counting from the top of the list. if you want to view the chart for all persons in the database (not only users) or select the user you want.
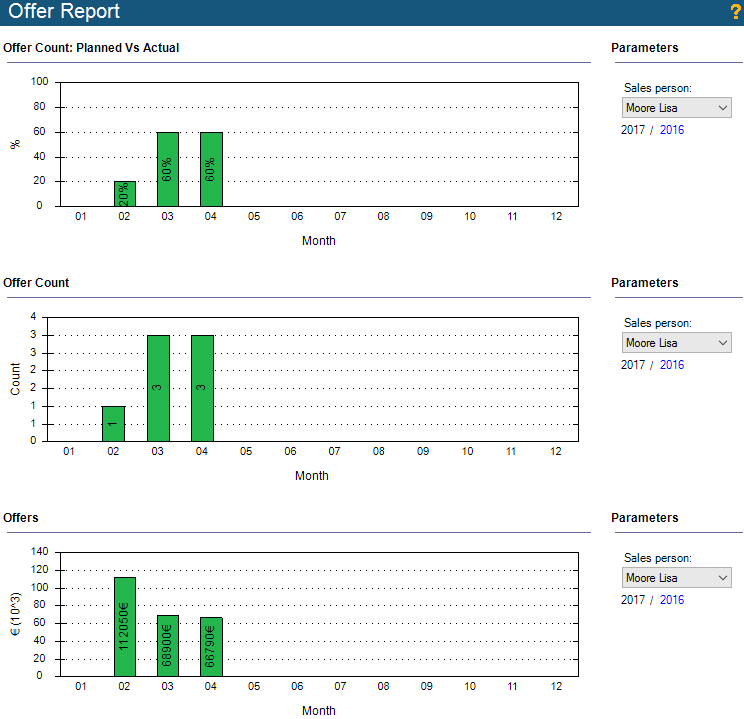
You can click the year to toggle the shown data for the current or previous year.