Sales Events
It shows the ratio of the total of sales events versus planned visits for selected people.
Two charts are shown at the same time so that you can set them differently and compare.
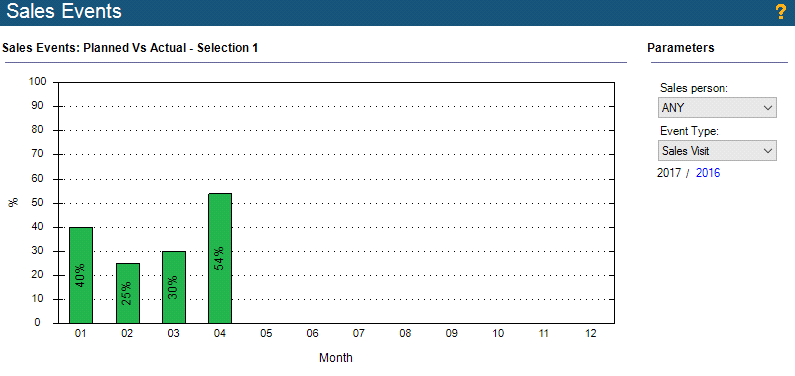
- Select ANY from the Sales Person list In lists objects are represented by small icons and object names. Icons help you to recognize object types. Press a keyboard character (a letter or a digit) to jump to the list item that starts from this character. The first matching item will be chosen, counting from the top of the list. if you want to view the chart for all persons in the database (not only users) or select the user you want.
- Select the needed type of event from the Event Type list to see data on events of this type.
You can click the year to toggle the shown data for the current or previous year.